|
Real-time Pathogen and Human Tumor Cell Sensitivity Detection Technology to Improve Food Safety |
By William L. Robinson, Jr.*, John R. Hurtt*, Edgar L. C. Alonsozana, MD, Denise M. Harmening, Ph.D1 and R. Benjamin Dawson, MD2
Summary: The Bactobridge H3 (an instrument that uses balanced impedance bridge circuitry and conductivity measuring tubes) has been developed by Hartech to measure bacterial and human tumor cell sensitivities to anti-bacterial and anti-cancer drugs. Resultant changes in the electrical conductivity of select media, due to the accumulation of metabolites of bacterial and cancer cell suspensions (relative to the properties of their cell wall and cell membrane associated ions) were measured as indices of metabolism and may reflect the rate of biosynthesis analogous with the glycolytic phosphorylation of ADP and ATP (1). This could serve as a convenient marker since up to 2,500,000 molecules of ATP are broken down to ADP and phosphate per second in order to achieve the biosynthesis of all the components of an E-coli cell. This is also significant, since cancer cells which are facultative (and can thus live aerobically or anaerobically) have a metabolic defect which causes them to use up relatively immense quantities of glucose by glycolysis even when they are supplied with oxygen and are still able to respire (2).
Introduction: We describe Hartech’s PC-based Bactobridge H3, (a general purpose clinical laboratory instrument) currently under initial clinical trial in the medical industry that can also be used on the farm and in the food industries for detection of foodborne pathogens (i.e., E-coli, salmonella, campylobacter and listeria, etc.), in real-time. The Bactobridge H3 has been cleared by the FDA and FSIS/USDA for non-invasive laboratory analysis in both clinical and veterinary medicine (3) (4). Most advanced optical (luminescent) instruments utilize combinations of technologies to determine rates of proliferation by bacteria in an appropriate growth medium and hence require the considerable time necessary for bacterial growth to cognizable size, which implies accurate bacterial identification and level determination prior to six hours, generally, and up to twelve hours, according to the particular bacterium’s natural rate of growth. During this delay damage caused by the organisms continues, particularly in industrial processes such as food production, where there may be no evidence of the presence of the microorganisms until the products have been spoiled. As a result, considerable economic losses and inconvenience will occur, if the product has already been distributed to retail outlets. Inoculations of 102 microorganisms per ml or more will cause an offset in the balanced impedance bridge circuit of the Bactobridge H3 and produce an electrical current (conductivity) curve that follows the integral of the viable count curve. Likewise, inoculations of cancer cell suspensions into the conductivity measuring tubes causes an offset in the balance of the impedance bridge facilitating low frequency conductivity measurements (of the medium) to detect early cell metabolism and subsequent cell division (5).
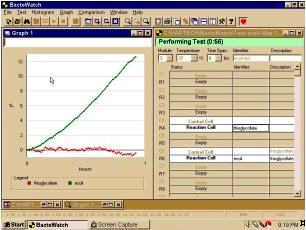
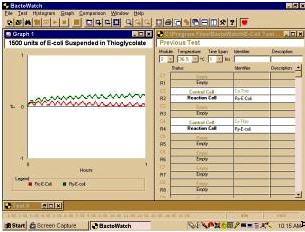
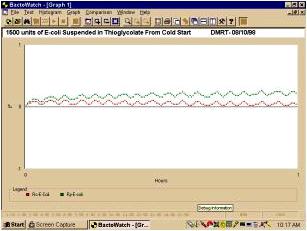
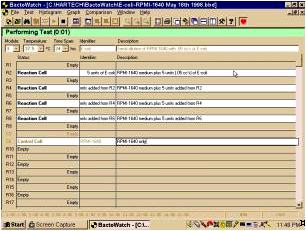
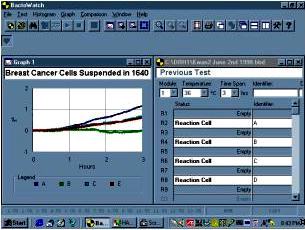
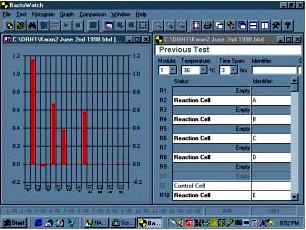
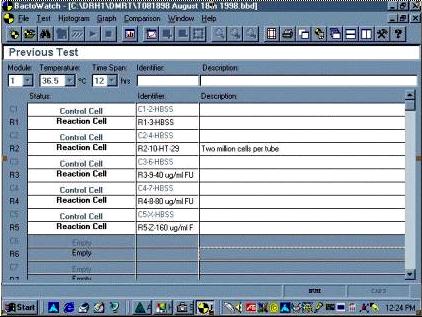
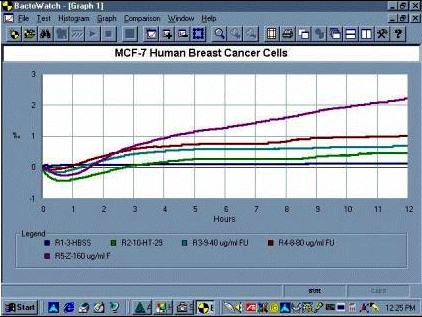
Materials and Methods: The PC-based Bactobridge H3 can be used in a Laboratory Information System (LIS) to collect both graphical and numerical data necessary to analyze a wide spectrum of foodborne and malignant diseases (i.e., cancer) in both the human and animal populations. The Bactobridge H3 comprises module blocks, each containing up to 20 conductivity measuring tubes maintained at a controlled temperature and time, which can be pre-set by the user through a Windows 95/NT software application called BactoWatch. The Bactobridge H3 and its associated system, includes a PC workstation that can electronically link up to 15 such modules with a total of 300 conductivity measuring tubes, which allows up to 270 dependent or 150 independent tests to be conducted, simultaneously. In the conductivity measuring tubes of the Bactobridge H3 the electrical conductivity of a test sample is continuously compared with the conductivity of a control sample in an impedance bridge circuit in which the test and control samples form opposing arms. The two samples are contained in a pair of conductivity measuring tubes, which are closely matched in their physical properties. In the impedance bridge circuit, an unknown is balanced against a standard for precise measurement of the electrical current (conductivity) of the medium. A 6-8 kHz rounded square wave from an oscillator designed to have less than 0.1% total harmonics activates the bridge circuit within the Bactobridge H3, resulting in virtually no DC component to the drive voltage. The sense system applies very small DC voltages and extremely small currents. The purity of the rounded square wave signal to the bridge and maintenance of the voltage below .5 volts peak to peak across the conductivity measuring tubes reduces the possibility of any polarization effect. The internal diameter of the conductivity measuring tubes varies from 6.20 to 6.23mm. The robust conductivity measuring tubes have a capacity of 3.5 ml and are autoclavable, and simple to fill using pipetting techniques. Bacterial tests have been performed using 150,000, 30,000, 1,500, 500, 250, 10, 5 and 1 E-coli suspended in enriched thioglycollate (Becton Dickinson). To determine viability cell count for E-coli, Ur et al and Alonsozana et al compared their solutions with the 0.5 McFarland Standard, which is an equivalent of 1.5 x 10⁸ organisms per ml. Cancer tests were performed with 1-2 x 10⁶ MCF-7 human tumor cells suspended in RPMI 1640 and Hank’s balanced salt non-nutritive solution. Viability and cell count was determined for cancer cells by the trypan blue dye exclusion assay on a hemacytometer.
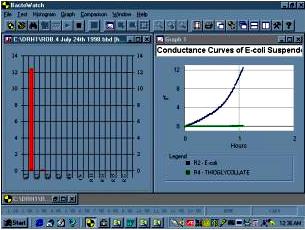
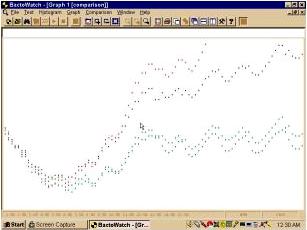
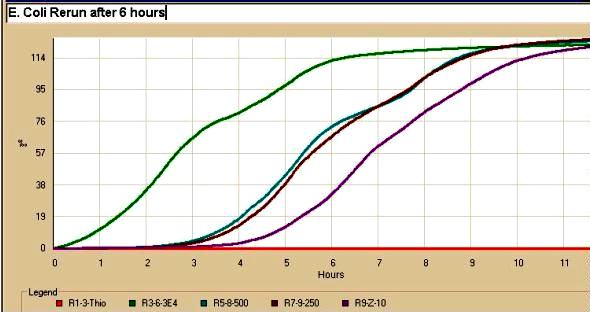
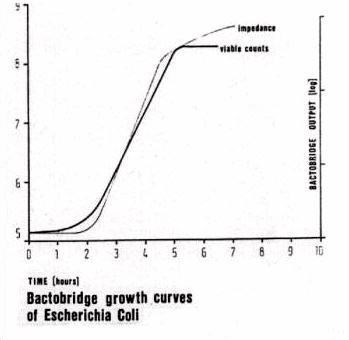
The characteristic conductance curve produced by the impedance bridge circuit is similar to the growth curve plotted from viable counts made on cultures grown under similar conditions (Fig 1). The curves differ in that the low frequency conductivity curves of bacteria generated by the Bactobridge H3, follows the integral of the viable count curve and are determined by the properties of their walls. This is expected as these conductivity curves relates to the accumulating metabolites of the microorganisms in the medium, rather than the increase in number microorganisms. This method, previously used for the detection of other reactions, such as blood coagulation (Ur, 1970a and b), isolates the signal caused by the activity of the microorganisms by canceling a major part of the "noise" and "drift" from other processes: such as temperature fluctuations; evaporation of water, enzymatic reactions in the medium and accidental contamination, which are common to test and control sample (6). Temperature has a large effect on conductivity. The conductivity of most solutions changes approximately 1.6 to 2.2% per degree C. As the temperature of a solution increases, the conductivity increases. Consequently, in the Bactobridge H3, thermistors are used to monitor the temperature inside the incubator. Careful matching of pairs of conductivity measuring tubes ensures that their resistance is within 10 ohms and that their capacitance and thermal properties match closely. The conductivity measuring tubes have electrodes that have a fixed area of platinum at a fixed distance apart. The optimum area and distance is different for different levels of conductivity. The distance between electrodes in the conductivity measuring tubes is designed for maximum conductivity and is controlled to within microns for each batch of cells.
|
|
The relationship of the two-platinum electrode conductivity measuring tubes filled with E-coli suspended in enriched thioglycollate is best represented by a resistance and a capacitance in series with no appreciable inductive component, as expressed by the formula (7):
Z2 = R2+ 1/(2p ¦ C)2, where R = Rr times L divided by A and thus
Z2 = (Rr * L/A)2+ 1/(2p ¦ C)2
Where Z is impedance, R is resistance, Rr is resistivity; A is cross sectional area, L is length, C is capacitance and ¦ is frequency. The impedance of a biological tissue comprises the resistance and the reactance. The conductive characteristics of cell wall provide the resistivity component (or specific resistance) defined as the resistance of a substance per unit volume whereas the cell membranes, acting as imperfect capacitors, contribute a frequency-dependent reactive component. The problem with using resistance as a measurement is that it depends not only on the materials from which the cell is made, but also the geometry of the cell. If somehow we were able to increase the length of the cell, for example, the measured resistance would increase. Also, if were to decrease the diameter of the cell, the measured resistance would increase. We therefore use the term resistivity to define a property that describes a cell’s ability to transmit electrical current in a medium that is independent of the cell’s geometrical factors (8).
The cell wall-associated ions play a major role in the conduction of low frequency electric current by intact bacterial cells. Since there is no mechanical barrier to the passage of ions from the cell wall into the environment, they must be held by electrostatic forces of the fixed charges in the wall. The effective, low frequency (10 to 10,000 CPS) conductivities of bacteria have been related to properties of their cell walls (Carstensen et al., 1965). Measurements of isolated walls of bacillus megaterium (Gerhard and Judge, 1964) and Micrococcus lysodeikticus (Britt and Gerhardt, 1958) indicate that as much as 90% of the cell wall space is water. Since mobile ion concentration is as great in the wall as it is in the cytoplasm, it is possible to rule out leakage as an important contribution to the population of ions in the wall and thus support the postulate that cell wall conductivity is directly related to the concentration of fixed charge in this region. The cell wall itself appears to be similar to an ion exchange resin in the sense that fixed, charged sites are distributed throughout the porous structure. The conductivity of the region is proportional to the environmental conductivity for high, environmental salt concentration and dependent only on counterion concentration when the environment salt concentration is low. This relationship leads to an estimate of 0.07 equivalents per liter for the fixed charge concentration in the wall of E-coli. Estimates of the number of titratable amino and carboxyl groups in wall polymers indicate that the conductivity is more closely related to net charge than to total charge. At low conductivities of the environment, the conductivity of the cell appears to be dominated by the counterions of the fixed charge of the cell wall. At higher conductivities of the suspending medium, evidence suggest that ions from the environment invade the cell wall causing an increase in the effective conductivity of the cell so that it takes on values roughly proportionally to that of the environment (9) (10) (11).
Changes in pH occurring in the medium in the conductivity measuring tubes can cause changes in conductance but the sensitivity of the Bactobridge H3 detection system allows recognition of bacterial growth before changes in pH due to that of growth take effect Typically in microbiological studies of E-coli, the control sample would be a sterile nutrient medium (i.e., thioglycollate) and the test sample would be the same medium inoculated with the studied microorganism. Small inoculi, such as 10 bacteria per ml in the conductivity measuring tubes do not disturb the bridge balance. Inoculi, of about 102 microorganisms per ml or more offset the balance of the bridge in a way, which enables immediate estimation of the number of microorganisms in the inoculum. The effective, homogenous, low frequency conductivity of whole cells increases as the culture cycle progress. Walls from cells harvested early in the culture cycle are more dense and have more titratable carboxyl groups per unit volume, lower conductivity than walls from cells harvested from cultures approaching stationary phase of growth. The dielectric constants of fresh and aged cells are virtually identical over the entire frequency range. Only the low frequency conductivity changes. One simply says that the conductivity of the cell wall of the aged cell is greater than that of the fresh cell (10).
Transmembrane potential (TMP) is defined as the electrical potential between the negative interior of the cell membrane and plasma environment (due to the presence of negative ions), with respect to the less negative or more positive potential of the exterior of the cell membrane and its tangential environment due to the presence of positive ions. In a normal, healthy, mitotically quiescent cell, the inner surface of the membrane is on the order of 50 to 60 more negative than its outer surface, and the TMP is therefore taken to be -50 to -60 mv within a relatively small margin; in this condition, the cell is said to be highly polarized (Cone, 1985). As the cell ages, sickens, starves or grows to a point where the membrane becomes progressively thinner, the TMP drops below the normal range (the membrane gradually becomes depolarized) and ATP production is reduced accordingly. When the TMP falls to circa -15 mv, mitosis is triggered and the cell divides (Cone, 1970). This endogenic phenomenon is naturally characteristic of the life cycle of normal cells; but when such depolarization is brought about by exogenic factors, mitosis is induced prematurely and uncontrolled proliferation results in the growth of a tumor (Cone, 1971).
Premature depolarization and mitosis leading to carcinogenesis may result from either a sustained increase in the intracellular concentration of Na+ ions (Cone, 1970 and 1974), or a surplus of negative ions (such as certain acid molecules bound to saccharides on the external wall of the cell membrane) (Cure, 1992), or both (Cure, 1976). In the latter case of carcinogenesis caused by surplus negative charges bound to the exterior of the membrane, a secondary effect may be postulated: since these charges would form a negative field or sheath around the cell, this would tend to repel negatively charged erythrocytes and lymphocytes, preventing the immune system from destroying the tumor cells (Cure, 1992).
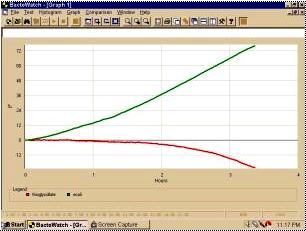
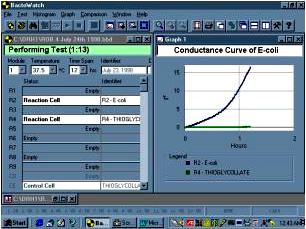
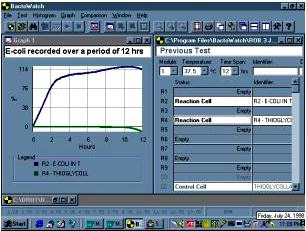
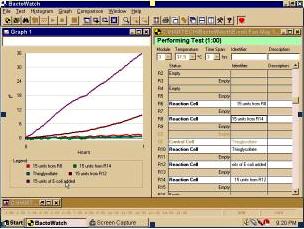
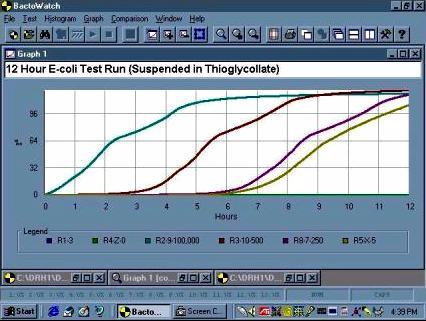
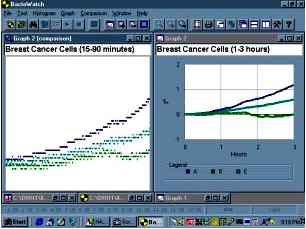
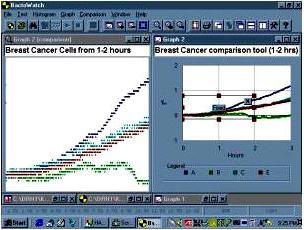
Results: The metabolic activity of 103 E-coli was detected within 15 minutes. Conductance curves of metabolic activity showed linear slopes for the concentrations of E-coli and Salmonella, tested. The duration of recording for conductance changes with both microorganisms was 1-12 hours (Fig. 2 & Tests 1-8). The duration for recording conductance changes for the experiments with human tumor cells performed by Ommaya et al was 60-90 minutes and by Alonsozana et al from 1-3 hours (Test 9). The characteristic conductance curves as monitored by the "Bactobridge" are similar to the growth curve plotted from variable counts made on cultures grown under similar conditions. The conductance curve shows the familiar characteristics of bacterial growth curves in the initial lag period, when multiplication is slow as the bacteria adjust to a new environment. The logarithmic phase, when multiplication of the organisms is consistently at the maximum rate for those conditions: and the stationary phase, when multiplication is slow due to exhaustion of nutrients or accumulation of toxic products of metabolism. The curves differ in that the "Conductance curve" follows the integral of the viable count curve. This was expected as the conductance curve relates to the accumulating metabolites of the microorganism, rather than the concentration of microorganisms (5).
|
|
|
Test #1 E-coli detection within 1 hour and over a period of 3 hours |
||||||||||||||||||||||||||||||||||||||||||||||||
|
|
|
|||||||||||||||||||||||||||||||||||||||||||||||
|
|
|
|
||||||||||||||||||||||||||||||||||||||||||||||
|
|
|
|||||||||||||||||||||||||||||||||||||||||||||||
|
Test #2 Detection of E-coli over a period of 1 hour |
|
|||||||||||||||||||||||||||||||||||||||||||||||
|
|
|
|||||||||||||||||||||||||||||||||||||||||||||||
|
|
|
|
||||||||||||||||||||||||||||||||||||||||||||||
|
|
|
|||||||||||||||||||||||||||||||||||||||||||||||
|
Test #3 Detection of E-coli |
|
|||||||||||||||||||||||||||||||||||||||||||||||
|
|
|
|||||||||||||||||||||||||||||||||||||||||||||||
|
|
|
|
||||||||||||||||||||||||||||||||||||||||||||||
|
|
|
|
||||||||||||||||||||||||||||||||||||||||||||||
|
|
|
|||||||||||||||||||||||||||||||||||||||||||||||
|
Tests #4 & 5 Early Detection of E-coli Using Amplification |
|
|||||||||||||||||||||||||||||||||||||||||||||||
|
|
|
|||||||||||||||||||||||||||||||||||||||||||||||
|
|
|
|
||||||||||||||||||||||||||||||||||||||||||||||
|
|
|
|
||||||||||||||||||||||||||||||||||||||||||||||
|
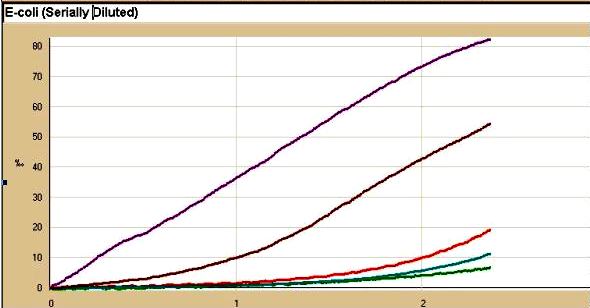
Test #6 & 7 Serially Diluted E-coli Suspended in Thioglycollate |
|||||||||||||||||||||||||||||||||||||||||||||||
|
|
|||||||||||||||||||||||||||||||||||||||||||||||
|
|
|
||||||||||||||||||||||||||||||||||||||||||||||
|
|
|||||||||||||||||||||||||||||||||||||||||||||||
|
|
|||||||||||||||||||||||||||||||||||||||||||||||
|
Test #7 (3 x 10⁴ - 1 x 101 Bacterium) |
|||||||||||||||||||||||||||||||||||||||||||||||
|
|
|||||||||||||||||||||||||||||||||||||||||||||||
|
|
|||||||||||||||||||||||||||||||||||||||||||||||
|
|
|||||||||||||||||||||||||||||||||||||||||||||||
|
Test #8a (1 x 10⁵ - 5 x 100 Bacterium) |
|||||||||||||||||||||||||||||||||||||||||||||||
|
|
|||||||||||||||||||||||||||||||||||||||||||||||
|
|
|||||||||||||||||||||||||||||||||||||||||||||||
|
|
|||||||||||||||||||||||||||||||||||||||||||||||
|
Test #8b |
|||||||||||||||||||||||||||||||||||||||||||||||
|
|
|||||||||||||||||||||||||||||||||||||||||||||||
|
|
|||||||||||||||||||||||||||||||||||||||||||||||
|
Test #9 MCF-7 Breast Cancer Cells |
|||||||||||||||||||||||||||||||||||||||||||||||
|
|
|||||||||||||||||||||||||||||||||||||||||||||||
|
|
|
||||||||||||||||||||||||||||||||||||||||||||||
|
|
|
||||||||||||||||||||||||||||||||||||||||||||||
|
. |
|
. |
Conclusion: Our new, proprietary electrical impedance invention has detected metabolic activity from small inoculations of E-coli, within 15 minutes. Accordingly, the low frequency conductivities of bacteria are deterministic by the properties of their walls. This was expected as the conductance curve relates directly to the accumulated metabolites of the microorganisms, rather than the increase in the number of microorganisms. This is an important fact, since cancer cells which are facultative (and can thus live aerobically or anaerobically) have a metabolic defect which causes them to use up relatively immense quantities of glucose by glycolysis even when they are supplied with oxygen and are still able to respire (2). The principle on which this work is based may, moreover, be useful in studies of antigen-antibody reactions and other investigations of reactions in liquid systems (5).
Discussion: The effect of lonidamine on glucose metabolism, hexokinase activity and adenylate pool of MCF-7 human breast cancer cells sensitive and resistant to adriamycin has been investigated by Franciulli et al, for its possible role in regulation of multiple drug resistance. The following summarizes their results: 1. In both cell types the greatest part of glucose was metabolized to lactate, whereas only a small proportion of glucose carbon atoms was incorporated into CO2, lipids, nucleic acids, and supporting structures. 2. Glucose utilization, lactate production, and ATP content were higher in resistant cells due to a greater activity of mitochondrial hexokinase. 3. Lonidamine decreased glucose utilization, aerobic glycolysis and ATP content in both cell types and the effect was significantly higher on resistant cells. 4. The extent of inhibition in sensitive and resistant cells overlapped that found for mitochondrially bound hexokinase, thus indicating that the greater sensitivity of resistant cells to lonidamine was due to their higher amount of bound hexokinase. These findings confirmed a modified glucose metabolism in cells with resistant phenotype and suggested that lonidamine might be usefully used to reduce or overcome multi-drug resistance of those cells with a reduced ability to accumulate and retain anti-tumor drugs (12).
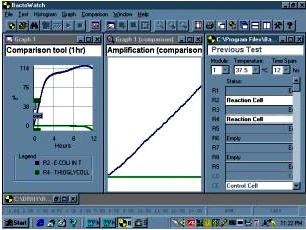
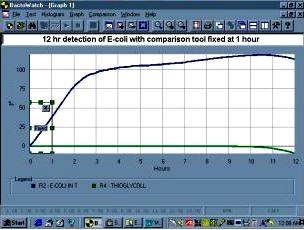
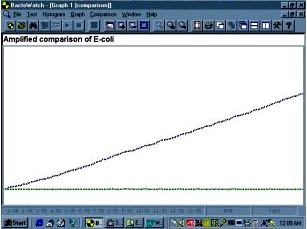
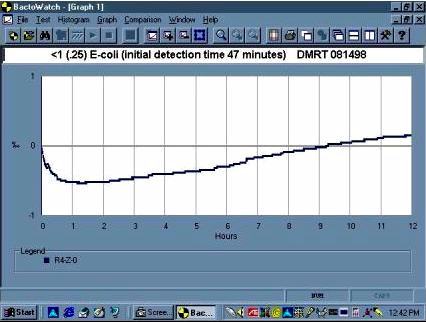
After extensive tests in both clinical and industrial laboratories, it appears as though the major advantage of the Bactobridge H3 over existing technologies is that there is no long incubation period necessary to grow bacteria or to cultivate tumor cell lines. Accurate and quantitative bacterial level determinations can be conducted very rapidly. The metabolic activity of 1,500 E-coli was detected within 15 minutes, while with an inoculum of less than 5 x 100 organisms the activity was detected in approximately 45 minutes. For most tests it is unnecessary to plot the entire conductance curve, so greater amplification of the signal could be used to allow closer analysis of the early parts of the curve. The activity of E-coli is obvious in less than 1 h when amplified, non-logarithmic scale is used; this contrast with the 2 h required, where the amplification is much less and the scale logarithmic. Similar curves have been observed with other organisms, but the speed and magnitude of response varied (6).
Other organisms detected by this method include species of Staphylococcus, Klebsiella, Serratia, Streptoccoccus, Pseudomonas (spoilage microflora), Lactobacillus, Pediococcus, Acetobacter, Candida and Mycoplasma. In most cases, they have been conducted in one to three hours without the need for long incubation periods compared to six to twelve hours as with other known instruments (5) (6). Evidence suggests the impedance changes measured by the bridge circuitry in the Bactobridge may accurately reflect alteration in the cellular metabolism of pathogens and human cancer cells. (13).
Therefore, in our opinions, the Bactobridge H3 could possibly serve as a science-based tool to provide information that is crucial for effective pathogen control and serve as a foundation for the treatment of malignant diseases (i.e., cancers), benefiting the medical and food industries and the general public.
Acknowledgments:
We thank: Christopher F. Frampton, Clive V. Mott and Barry J and Mark Belcher for technical assistance, Paul A. Griffey and Willi Q. Cartwright for academic/medical research assistance, Dr. (s) Ur, Ommaya and Vucenik for clinical laboratory assistance, Dr. Mohammed Al Shaikly for irradiation of the conductivity measuring test tubes, Martha E. Robinson for typing and researching the manuscript and particularly, Ms. Kwanchanit Tantivejkul for providing the Breast Cancer Cells.
* In January 1998, the authors filed an environmental assessment report to amend their Food Additive Petition (F.A.P. #1M4246) currently pending with the FDA, proposing that the food additive regulations be amended to provide for a safe use of a source of radiation to control foodborne pathogens in shellfish. On January 9, 1996, they received US Patent #5,482,726 – "Methods to Decontaminate Shellfish".
References:
|
Cancer Clinical Trials |
Valuation of Bactobridge Technology Investment Information |
|
The Department of Medical and Research Technology, |